Designing Trust in a Silent, High-Stakes Security System
Redesigned a high-stakes security dashboard to improve trust, reduce false urgency, and support confident decision-making.
Role
Senior Product Designer
The Challenge
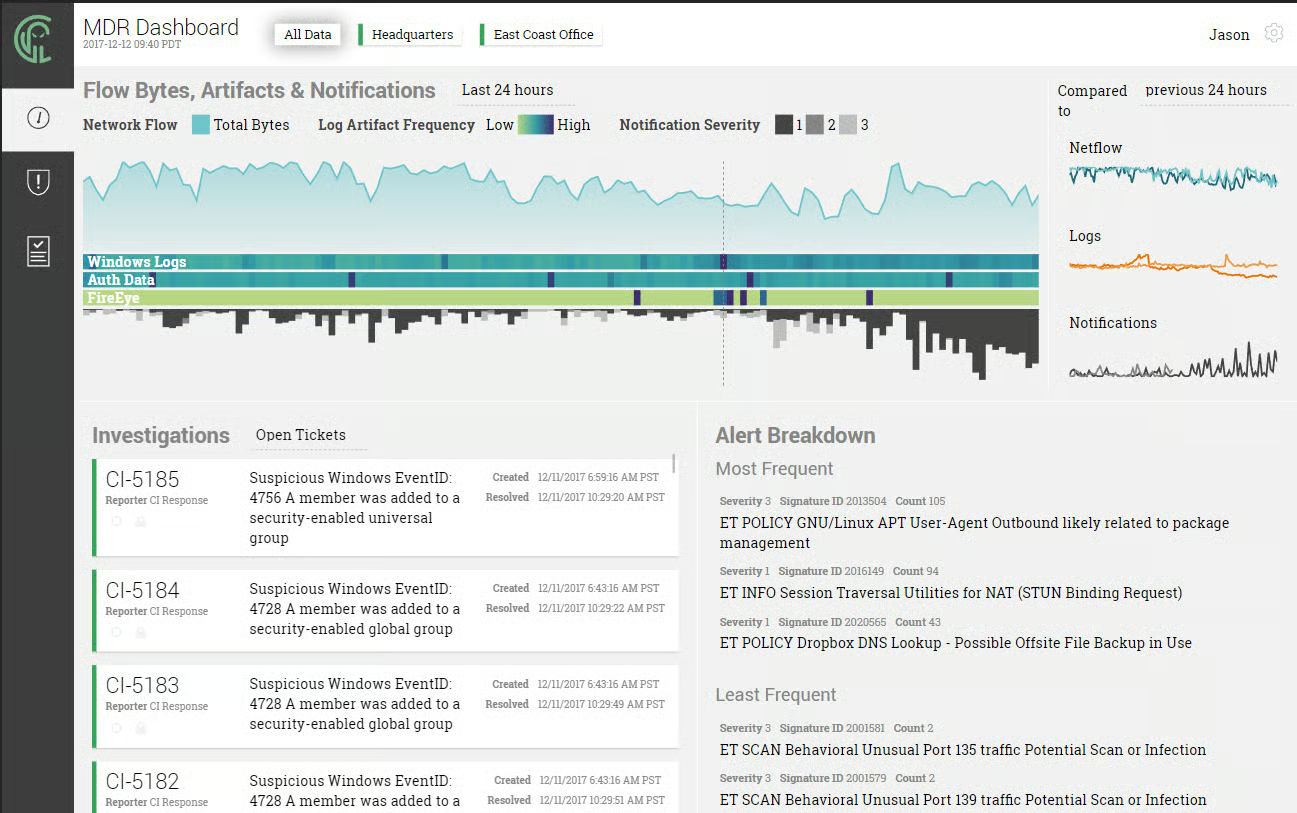
The key design challenge: make invisible security work visible without creating anxiety or false urgency. Early dashboard concepts exposed too much raw data and leaned heavily on alert-oriented visual language. This unintentionally encouraged users to investigate events themselves rather than trust the MDR team's monitoring role.
Early concepts emphasized alerts and detailed visualizations. The hierarchy and visual language had to be refined to reduce alert density, emphasize system health, and shift attention toward trends instead of isolated events.
“Users gravitated toward red signals and interpreted normal system behavior as risk.”
Context & Complexity
The project was created for CI Security's Managed Detection and Response (MDR) dashboard. CI Security served organizations without internal security teams. The dashboard was primarily used by IT leaders, security leaders, and non-specialist stakeholders. Users came with two questions: Is CI doing their job? Is there anything I should know about?
Users gravitated toward red signals; normal behavior read as risk
Alert density competed with signal; hierarchy needed refinement
System health and trends mattered more than isolated events
Approach
Iteration one
Early concepts emphasized alerts and detailed visualizations. Users gravitated toward red signals and interpreted normal system behavior as risk. The approach validated the need for a different visual language.
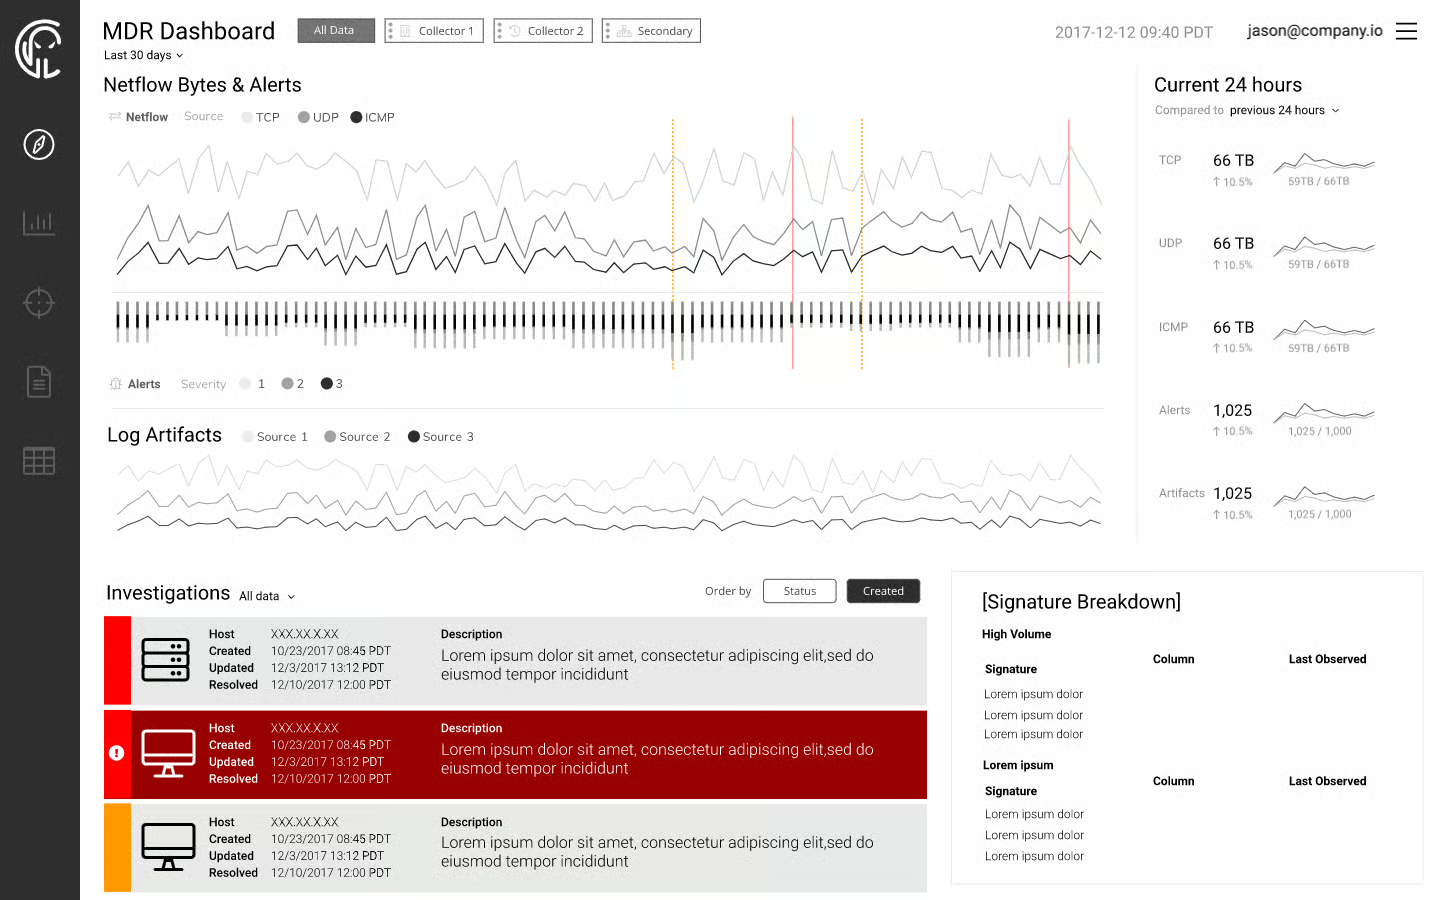
Iteration two
Hierarchy and visual language were refined: reduced alert density, emphasized system health, shifted attention toward trends instead of isolated events. Trust in the MDR team's role became the design goal.
Technical prototype
A functional prototype was built using HTML, JavaScript, and D3 with scrubbed real-world collector data. This allowed realistic validation before implementation.
Initial wireframes
Getting an understanding of what the data might look like
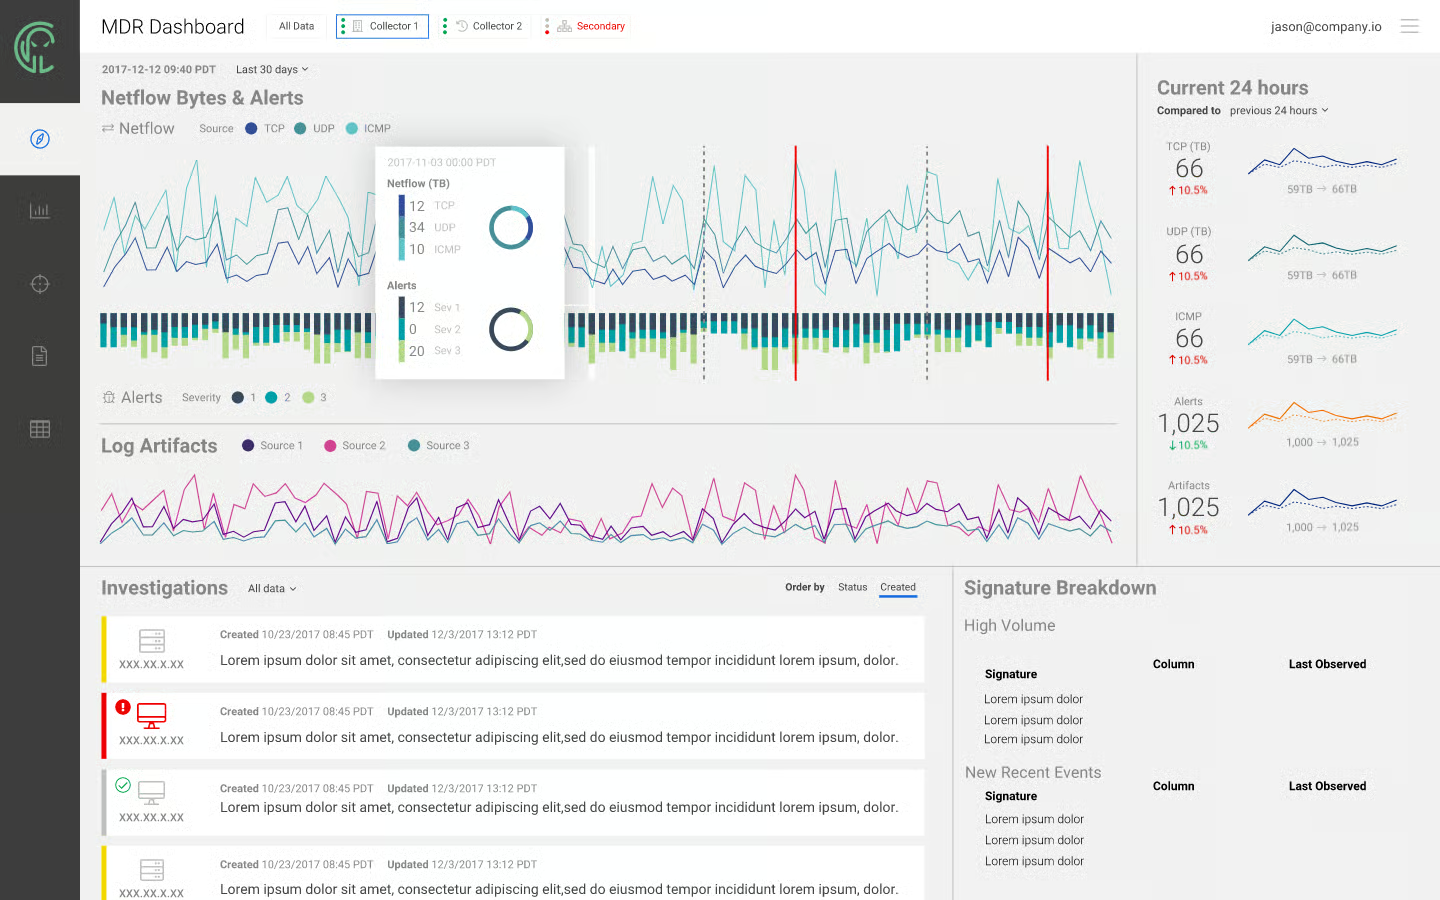
Refined hierarchy
System health view with reduced alert density and trend-based emphasis
D3 prototype
Functional prototype built with real-world collector data for validation
Outcomes
Increased client confidence
Clients reported stronger trust in MDR services. The dashboard clarified the monitoring role without inviting unnecessary investigation.
Internal dogfooding and sales enablement
Analysts used the dashboard internally. The prototype also became a sales enablement tool for demonstrating MDR value.
What mattered most
In high-stakes systems, clarity and emotional neutrality are functional product decisions, not aesthetic preferences.
Next Case Study